Definity Analyzer Help
- What is Definity Analyzer?
- Installation
- How to use
- Main window
- Description of menu items
- Description of tool bar
- How to setup MST
1. What is Definity Analyzer?
Definity Analyzer is SOLELY software analyzer for parsing of PBX
Definity system messages that is accessible via Message Sequence Trace (MST)
ATTENTION! This software and this manual is intended for Definity experts only that have appropriate skill in this area.
2. How to install Definity analyzer on your computer
To install Definity Analyzer you need two ZIP archives from http://defanalyzer.narod.ru:
Environment.zip with supplement files for Definity Analyzer
(these files are common for all 4.x.x versions of Definity Analyzer) and the
archive with last version of Definity Analyzer, and then do the following:
- Unpack Environment.zip
to separate newly created directory.
- Run SETUP.EXE from that directory and follow its
instructions.
- Unpack Definity Analyzer's archive to an other separate newly created
directory.
- Run SETUP.EXE
from that directory and follow its instructions.
3. How to use Definity Analyzer
-
Log on Definity using the login with permission to access
MST command. Use Terranova terminal program to do it.
-
Set up MST by
change
mst command.
-
Enable MST by enable
mst command.
-
Do test calls. Definity Analyzer can process up to 1000 calls (the unregistered version up to
20). In fact the maximum quantity of processed calls is unlimited and
depends on the parameters of your computer.
-
Enable Capture in Terranova. Doesn't matter the file name
you enter - just remember it.
-
Run list mst cont in Terranova window.
-
Disable
Capture in Terranova after the test calls have been done.

-
Run Definity Analyzer.
Choose "New Analyz", then open the capture file with
message trace (you entered it in Terranova Capture menu - do you
remember?). You can choose previously prepared databases in "Existing"
and "Recent"
options (this function is available in the registered version only!).
These databases are saved in Microsoft Access MDB format. In the future you
won't need to process capture files again - you'll can work with prepared
database directly.
After choosing the file for analysis, its processing will begin.
If you click
Cancel, you can choose the file later via menu or button. Also you can
press F1 function key at the main window to open the file for analysis.
4. Main window

The main window contains 5 fields:
-
Menu.
-
Tool bar.
-
List of calls (or ports in case of the analysis of MFC Signaling).
-
List of messages concerning selected call (or port in case
of the analysis of MFC Signaling).
-
Detailed parsing of the selected message; also has bookmarks
with phone numbers found at R1.5 and R2 tracing (second bookmark) and with
status of an autorefresh (third bookmark).
5. Menu items
First menu "File":

-
New Analysis (F1) - open new trace file for an analysis.
-
Open Analysis (F2) - open prepared database file with an
analysis.
-
Save analysis into file (F3) - save current analysis to the
database file.
-
Open text file (F4) - open chosen text file with notepad
editor.
-
Four recent databases. You can open any of them for work.
-
Exit.
Second menu "Options":

-
Clear the database. Completely clears the current database.
-
Show in analysis real number of message. This option turns
on displaying in analysis the string number in capture text file there MST
message is located and its number.
-
Registrate. This option do the registration of this
software. A lot of service functions will be available after the registration.
All questions about the registration please send to
defanalyzer@narod.ru.
-
This option creates the diskette to transfer registration to
an other computer.
-
Erase ToolTip. This option takes away tool tips if they are
annoying.
-
Erase ToolTip on the main window. This option takes away
additional tool tips at the main window.
-
Minimize the main window. This option restores
initial size to the main window.
-
Input default directory. The capture files will be open from
this directory.
-
Show Tips at Startup. This option turns on displaying of
"The Tip of The Day" at startup.
-
Change Color. You can change the colors of the
fields in the main window by this submenu.
-
This option allows changing of the title of the main window.
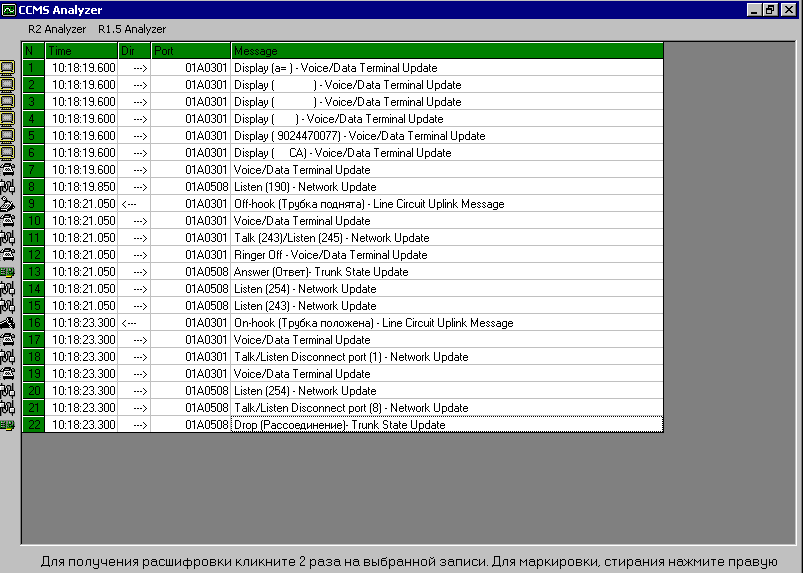
Third and fourth menus "CCMS Analyzer" and "R2 Analyzer" run corresponding analyzers. These options work with
CCMS data only. "CCMS Analyzer" does analysis of TDM time slots and fetches the full trace of the port with all "tied" ports and sort them
by time. Such processing scheme emulates hardware R1.5 and R2 analyzers
and displays all signaling information such as called/calling (ANI) numbers and other
multifrequency signals. Analyzed data can be saved to the file.
Examples of CCMS and R2 analyzers:

Sorry, now in Russian only:

Fiveth menu "R1.5 Analyzer" isn't activated, because
of it is under the testing.
Sixth menu "Services":

-
On/Off the mode of auto refresh. This options turn on quasi on-line
analyzer. The selected capture file is checked every x seconds and new trace
data is automatically loaded. As a result the new trace data can be seen in
Definity Analyzer in a few seconds after displaying in Terranova window. It
creates the on-line analysis effect.
-
Show the connective ports. This function looks for
"tied" ports. "Tied" ports is the port that was
connected to the chosen port in the concerned time period. For example,
using this function the tone-clock port that was used in register
signaling on DS1 port can be found. This search based on the search of
TDM time slots that was used to connect both (DS1 and tone-clock) ports.
-
To calculate AngelID. To calculate AngelID for CCMS setup in
change
mst.
-
Input the trace in manual mode. This is debug mode intended
for critical situation such as corruption of the capture file and etc.
-
Marker. This option marks some positions in the call table
for easy finding them later. This positions will be marked in the analysis
file too. To mark particular call just make
double-click on it.
-
Find (F7). Searches call table for call with specified Calling Number, Called Number,
Call Number. Also works in CCMS mode, i.e. can find specified port.
-
Find next (F8). Searches next call with specified criteria.
-

To sort. Sorts call table by any chosen column, i.e. Number, Call Number,
Calling Number, Called Number. You can sort in ascending (first submenu
item) or descending (second submenu item) order. Just choose the type of
sorting and then click on desired column in call table.
Seventh menu "Options
CCMS": this menu contains options concerned with processing of CCMS
data.
-

Type of show direction. In fact the messages are transmitted with type
"up" (from PROCESSOR board to other board) or "down"
(vice versa). But the representation "->/<-" is more
convenient.
-

Ignore messages of CCMS. Turns on filtering of CCMS data at import level.
It can be used in case of huge amount of trace data. Sometimes there a lot
of unuseful (in point of Definity Analyzer user's view, of cause)
message concerning refreshing phone displays, refreshing board parameters,
seizing TDM bus (be careful - if you choose "Ignore Network Update",
then the functions "Show the connective ports", "CCMS
Analyzer" and "R2 Analyzer" won't work).
-

Type of carrier. At processing of CCMS data the board number will be
displayed. In fact inside PBX there is other numbering plan called AngelID
that is related to usual board name. For different carriers such relations are
different also. So you should specify your carrier type in this submenu.
Eighth menu "Help":

-
English/Russian.
This option switches the language of the menu from English to Russian and
vice versa.
-
Help. Displays this page.
-
Examples of analysis. You guessed what does it mean, isn't
it? ;)
-
New additions. The list of newly added functions.
-
Version. Displays the number and the date of your copy of
Definity Analyzer.
6. Description of Tool Bar

- New Analysis.
- Open prepared call database.
- Save current analysis to the file.
- Open text file with notepad editor.
- Definity Analyzer options.
- CCMS options.
- CCMS analyzer.
- R2 analyzer.
- R1.5 analyzer (isn't activated now).
- Autorefresh (quasi on-line analyzer).
- Mark.
- Display tied ports.
- Sort (just click on this button to sort by last chosen criteria or
ascending if it wasn't chosen; click down arrow right to button to choose
the type of sorting).
- Find.
- Switch the language of the menu from English to Russian and vice versa.
- Help.
7. MST setup (Message Sequence
Trace)
After entering change mst command, you get following
form:

- Trace ISDN PRI calls.
- Trace ISDN BRI calls.
- Trace CCMS (it's necessary for tracing of R2, R1.5 calls). You can see the
trace of 3-wire and 2-wire trunks, the state of phone and even the phone
displays.
- Trace CDR ports. It's the only way to get CDR remotely via the management terminal.
ISDN PRI and ISDN BRI MST setup:

- Choose port type from the following:
1. all. All ISDN PRI will be traced.
2. D-channel. All ISDN PRI calls on specified DS1 board will be traced.
3. B-channel. All ISDN PRI calls on specified time slot will be traced..
- Trace or not some service information and ISDN level 2 primitives.
- Specify the port in case of D-channel or B-channel is chosen.
- Set filtering by calling and called numbers.
- Same as 1,2,3,4 for ISDN BRI.
CCMS MST setup:

The changing of fields 1 and 2 doesn't recommended, i.e. some important
information can be lost without essential decreasing of total amount of
messages.
We recommend set "all" in field 3 - in this case important
information won't be lost. The main reason to do it is the following: in MF
register signaling tone-clock or call classifier ports can be used from any
board in PBX in random way. The trace information about tone-clock or call
classifier port is necessary for R2 or CCMS analyzer to do full analysis of the
call and display all signaling information.
In the fields CCMS/PACKET ports you can set the boards or ports for which
trace information will be gathered. It should notice that regardless of the fact
that call classifier ports can be entered, to enter tone-clock you must enter
its AngelID. You can get AngelID of tone-clock via "Calculate
AngelID" menu option.
CDR MST setup:

- Set which CDR port (primary or secondary) to trace.
- Set filtering by criteria similar to change system
cdr settings.
- Set filtering by called and calling numbers.
® The author of Definity Analyzer: defanalyzer@narod.ru
® The refinement of Definity Analyzer documentation and the translation to
English: Alexey Kuznetsov, avk@gamma.ru


